Preparing For Interaction To Next Paint, A New Web Core Vital
Geoff Graham 2023-12-07T21:00:00+00:00
2024-06-12T20:05:40+00:00
This article is sponsored by DebugBear
There’s a change coming to the Core Web Vitals lineup. If you’re reading this before March 2024 and fire up your favorite performance monitoring tool, you’re going to to get a Core Web Vitals report like this one pulled from PageSpeed Insights:
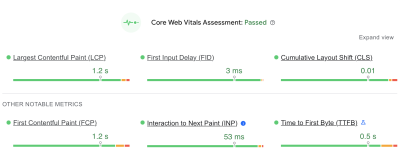
You’re likely used to seeing most of these metrics. But there’s a good reason for the little blue icon sitting next to the second metric in the second row, Interaction to Next Paint (INP). It’s the newest metric of the bunch and is set to formally be a ranking factor in Google search results beginning in March 2024.
And there’s a good reason that INP sits immediately below the First Input Delay (FID) in that chart. INP will officially replace FID when it becomes an official Core Web Vital metric.
The fact that INP is already available in performance reports means we have an opportunity to familiarize ourselves with it today, in advance of its release. That’s what this article is all about. Rather than pushing off INP until after it starts influencing the way we measure site performance, let’s take a few minutes to level up our understanding of what it is and why it’s designed to replace FID. This way, you’ll not only have the information you need to read your performance reports come March 2024 but can proactively prepare your website for the change.
“I’m Not Seeing Those Metrics In My Reports”
Chances are that you’re looking at Lighthouse or some other report based on lab data. And by that, I mean data that isn’t coming from the field in the form of “real” users. You configure the test by applying some form of simulated throttling and start watching the results pour in. In other words, the data is not looking at your actual web traffic but a simulated environment that gives you an approximate view of traffic when certain conditions are in place.
I say all that because it’s important to remember that not all performance data is equal, and some metrics are simply impossible to measure with certain types of data. INP and FID happen to be a couple of metrics where lab data is unsuitable for meaningful results, and that’s because both INP and FID are measurements of user interactions. That may not have been immediately obvious by the name “First Input Delay,” but it’s clear as day when we start talking about “Interaction to Next Paint” — it’s right there in the name!
Simulated lab data, like what is used in Lighthouse reports, does not interact with the page. That means there is no way for it to evaluate the first input a user makes or any other interactions on the page.
So, that’s why you’re not seeing INP or FID in your reports. If you want these metrics, then you will want to use a performance tool that is capable of using real user data, such as DebugBear, which can monitor your actual traffic on an ongoing basis in real time, or PageSpeed Insights which bases its finding on Google’s “Chrome User Experience Report” (commonly referred to as CrUX), though DebugBear is capable of providing CrUX reporting as well. The difference between real-time user monitoring and measuring performance against CrUX data is big enough that it’s worth reading up on it, and we have a full article on Smashing Magazine that goes deeply into the differences for you.
INP Improves How Page Interactions Are Measured
OK, so we now know that both INP and FID are about page interactions. Specifically, they are about measuring the time between a user interacting with the page and the page responding to that interaction.
What’s the difference between the two metrics, then? The answer is two-fold. First, FID is a measure of the time it takes the page to start processing an interaction or the input delay. That sounds fine on the surface — we want to know how much time it takes for a user to start an interaction and optimize it if we can. The problem with it, though, is that it takes just one part of the time for the page to fully respond to an interaction.
A more complete picture considers the input delay in addition to two other components: processing time and presentation delay. In other words, we should also look at the time it takes to process the interaction and the time it takes for the page to render the UI in response. As you may have already guessed, INP considers all three delays, whereas FID considers only the input delay.
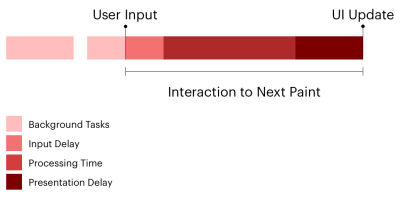
The second difference between INP and FID is which interactions are evaluated. FID is not shy about which interaction it measures: the very first one, as in the input delay of the first interaction on the page. We can think of INP as a more complete and accurate representation of how fast your page responds to user interactions because it looks at every single one on the page. It’s probably rare for a page to have only one interaction, and whatever interactions there are after the first interaction are likely located well down the page and happen after the page has fully loaded.
So, where FID looks at the first interaction — and only the input delay of that interaction — INP considers the entire lifecycle of all interactions.
“
Measuring Interaction To Next Paint
Both FID and INP are measured in milliseconds. Don’t get too worried if you notice your INP time is greater than your FID. That’s bound to happen when all of the interactions on the page are evaluated instead of the first interaction alone.
Google’s guidance is to maintain an FID under 100ms. And remember, FID does not take into account the time it takes for the event to process, nor does it consider the time it takes the page to update following the event. It only looks at the delay of the event process.
And since INP does indeed take all three of those factors into account — the input delay, processing time, and presentation delay — Google’s guidance for measuring INP is inherently larger than FID: under 200ms for a “good” result, and between 200-500ms for a passing result. Any interaction that adds up to a delay greater than 500ms is a clear bottleneck.

The goal is to spot slow interactions and optimize them for a smoother user experience. How exactly do you identify those problems? That’s what we’re looking at next.
Identifying Slow Interactions
There’s already plenty you can do right now to optimize your site for INP before it becomes an official Core Web Vital in March 2024. Let’s walk through the process.
Of course, we’re talking about the user doing something on the page, i.e., an action such as a click or keyboard focus. That might be expanding a panel in an accordion component or perhaps triggering a modal or a prompt any change in a state where the UI updates in response.
Your page may consist of little more than content and images, making for very few, if any, interactions. It could just as well be some sort of game-based UI with thousands of interactions. INP can be a heckuva lot of work, but it really comes down to how many interactions we’re talking about.
We’ve already talked about the difference between field data and lab data and how lab data is simply unable to measure page interactions accurately. That means you will want to rely on field data when pulling INP reports to identify bottlenecks. And when we’re talking about field data, we’re talking about two different flavors:
- Data from the CrUX report that is based on the results of real Chrome users. This is readily available in PageSpeed Insights and Google Search Console, not to mention DebugBear. If you use either of Google’s tools, just note that their throttling methods collect metrics on a fast connection and then estimate how fast the page would be on a slower connection. DebugBear actually tests with a slower network, resulting in more accurate data.
- Monitoring your website’s real-time traffic, which will require adding a snippet to your source code that sends traffic data to a service. And, yes, DebugBear is one such service, though there are others. You can even take advantage of historical CrUX data integrated with BigQuery to get a historical view of your results dating back as far as 2017 with new data coming in monthly, which isn’t exactly “real-time” monitoring of your actual traffic, but certainly useful.
You will get the most bang for your buck with real-time monitoring that keeps a historical record of data you can use to evaluate INP results over time.
That said, you can still start identifying bottlenecks today if you prefer not to dive into real-time monitoring right this second. DebugBear has a tool that analyzes any URL your throw at it. What’s great about this is that it shows you the elements that receive user interaction and provides the results right next to them. The result of the element that takes the longest is your INP result. That’s true whether you have one component above the 500ms threshold or 100 of them on the page.
The fact that DebugBear’s tool highlights all of the interactions and organizes them by INP makes identifying bottlenecks a straightforward process.
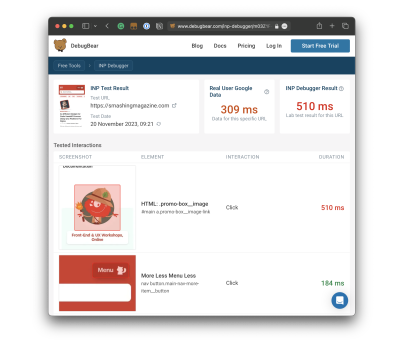
See that? There’s a clear INP offender on Smashing Magazine’s homepage, and it comes in slightly outside the healthy INP range for a score of 510ms even though the next “slowest” result is 184ms. There’s a little work we need to do between now and March to remedy that.
Notice, too, that there are actually two scores in the report: the INP Debugger Result and the Real User Google Data. The results aren’t even close! If we were to go by the Google CrUX data, we’re looking at a result that is 201ms faster than the INP Debugger’s result — a big enough difference that would result in the Smashing Magazine homepage fully passing INP.
Ultimately, what matters is how real users experience your website, and you need to look at the CrUX data to see that. The elements identified by the INP Debugger may cause slow interactions, but if users only interact with them very rarely, that might not be a priority to fix. But for a perfect user experience, you would want both results to be in the green.
Optimizing Slow Interactions
This is the ultimate objective, right? Once we have identified slow interactions — whether through a quick test with CrUX data or a real-time monitoring solution — we need to optimize them so their delays are at least under 500ms, but ideally under 200ms.
Optimizing INP comes down to CPU activity at the end of the day. But as we now know, INP measures two additional components of interactions that FID does not for a total of three components: input delay, processing time, and presentation delay. Each one is an opportunity to optimize the interaction, so let’s break them down.
Reduce The Input Delay
This is what FID is solely concerned with, and it’s the time it takes between the user’s input, such as a click, and for the interaction to start.
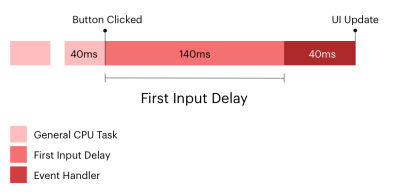
This is where the Total Blocking Time (TBT) metric is a good one because it looks at CPU activity happening on the main thread, which adds time for the page to be able to respond to a user’s interaction. TBT does not count toward Google’s search rankings, but FID and INP do, and both are directly influenced by TBT. So, it’s a pretty big deal.
You will want to heavily audit what tasks are running on the main thread to improve your TBT and, as a result, your INP. Specifically, you want to watch for long tasks on the main thread, which are those that take more than 50ms to execute. You can get a decent visualization of tasks on the main thread in DevTools:
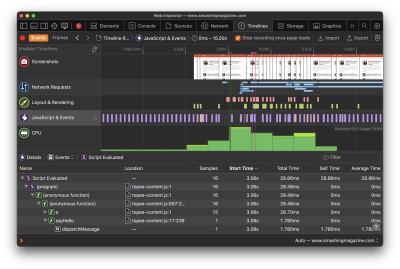
The bottom line: Optimize those long tasks! There are plenty of approaches you could take depending on your app. Not all scripts are equal in the sense that one may be executing a core feature while another is simply a nice-to-have. You’ll have to ask yourself:
- Who is the script serving?
- When is it served?
- Where is it served from?
- What is it serving?
Then, depending on your answers, you have plenty of options for how to optimize your long tasks:
- Use Web Workers to establish separate threads for tasks to get scripts off the main thread.
- Split JavaScript bundles into individual pieces for smaller payloads.
- Async or defer scripts that can run later without affecting the initial page load.
- Preconnect network connections, so browsers have a hint for other domains they might need to connect to. (It’s worth noting that this could reveal the user’s IP address and conflict with GDPR compliance.)
Or, nuke any scripts that might no longer be needed!
Reduce Processing Time
Let’s say the user’s input triggers a heavy task, and you need to serve a bunch of JavaScript in response — heavy enough that you know a second or two is needed for the app to fully process the update.
- Try creating a loading state that triggers immediately and perform the work in a
setTimeout()callback because that’s a much quicker way to respond to the user interaction than waiting for the complete update. - If you’re working in React, make sure you are preventing your components from re-rendering unnecessarily.
- Remember that
alert(),confirm(), andprompt()are capable of adding to the total processing time as they run synchronously and block the main thread. That said, it appears there could be plans to change that behavior ahead of INP becoming a formal Core Web Vital.
Reduce Presentation Delay
Reducing the time it takes for the presentation is really about reducing the time it takes the browser to display updates to the UI, paint styles, and do all of the calculations needed to produce the layout.
Of course, this is entirely dependent on the complexity of the page. That said, there are a few things to consider to help decrease the gap between when an interaction’s callbacks have finished running and when the browser is able to paint the resulting visual changes.
One thing is being mindful of the overall size of the DOM. The bigger the DOM, the more HTML that needs to be processed. That’s generally true, at least, even though the relationship between DOM size and rendering isn’t exactly 1:1; the browser still needs to work harder to render a larger DOM on the initial page load and when there’s a change on the page. That link will take you to a deep explanation of what contributes to the DOM size, how to measure it, and approaches for reducing it. The gist, though, is trying to maintain a flat structure (i.e., limit the levels of nested elements). Additionally, reviewing your CSS for overly complex selectors is another piece of low-hanging fruit to help move things along.
While we’re talking about CSS, you might consider looking into the content-visibility property and how it could possibly help reduce presentation delay. It comes with a lot of considerations, but if used effectively, it can provide the browser with a hint as far as which elements to defer fully rendering. The idea is that we can render an element’s layout containment but skip the paint until other resources have loaded. Chris Coyier explains how and why that happens, and there are aspects of accessibility to bear in mind.
And remember, if you’re outputting HTML from JavaScript, that JavaScript will have to load in order for the HTML to render. That’s a potential cost that comes with many single-page application frameworks.
Gain Insight On Your Real User INP Breakdown
The tools we’ve looked at so far can help you look at specific interactions, especially when testing them on your own computer. But how close is that to what your actual visitors experience?
Real user-monitoring (RUM) lets you track how responsive your website is in the real world:
- What pages have the slowest INP?
- What INP components have the biggest impact in real life?
- What page elements do users interact with most often?
- How fast is the average interaction for a given element?
- Is our website less responsive for users in different countries?
- Are our INP scores getting better or worse over time?
There are many RUM solutions out there, and DebugBear RUM is one of them.
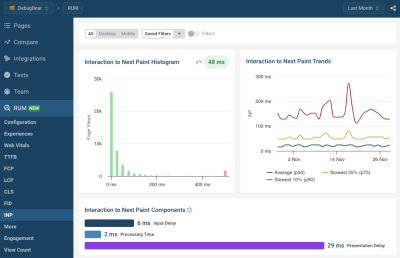
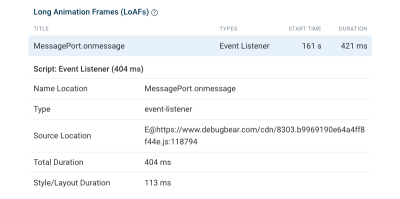
DebugBear also supports the proposed Long Animation Frames API that can help you identify the source code that’s responsible for CPU tasks in the browser.
Conclusion
When Interaction to Next Paint makes its official debut as a Core Web Vital in March 2024, we’re gaining a better way to measure a page’s responsiveness to user interactions that is set to replace the First Input Delay metric.
Rather than looking at the input delay of the first interaction on the page, we get a high-definition evaluation of the least responsive component on the page — including the input delay, processing time, and presentation delay — whether it’s the first interaction or another one located way down the page. In other words, INP is a clearer and more accurate way to measure the speed of user interactions.
Will your app be ready for the change in March 2024? You now have a roadmap to help optimize your user interactions and prepare ahead of time as well as all of the tools you need, including a quick, free option from the team over at DebugBear. This is the time to get a jump on the work; otherwise, you could find yourself with unidentified interactions that exceed the 500ms threshold for a “passing” INP score that negatively impacts your search engine rankings… and user experiences.
(yk, il)
